Thursday, July 24, 2008
Wednesday, July 23, 2008
AAPL - Fill the Gap Strategy
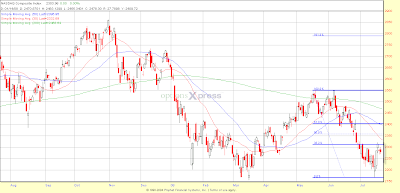 Chart 1: Nasdaq Composite Index
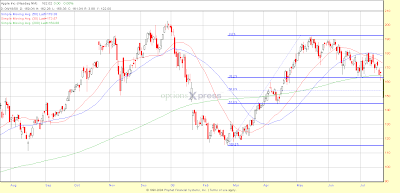
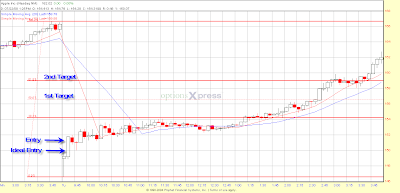
Chart 3: AAPL Intra-day Chart
The following happened while I was conducting a handholding session yesterday and demonstrated a “Live” trade on a paper trading account.
AAPL announced their quarterly earnings results the night before (21 July 08 - after market close). As usual, it released a stunning set of results. But the stock gapped down at pre-market hours (as much as $18.00) due to less than expected earnings forecast. But AAPL is known to lower its analysts' expectations by lowering its forecast. A similar gap down happened in April when AAPL gave a lower than expected forecast. But the stock subsequently reversed and went up. A possible Fill-the-Gap strategy is identified.
Initially, I planned to enter immediately after the stock went above the ideal point - buying AAPL Aug 150 Call option for $7.00. In the midst of the excitement, instead of buying, I sold the Call option instead. I realized my mistake. By the time I closed my position and opened a new position in AAPL Aug 150 Call Option, I can only manage to enter a trade at $8.00. The mistake cost me an opportunity cost of $1.00.
In the class, I mentioned that if the stock remained around or below the 38.2%Fibonacci level (in an intraday chart) towards the end of the day, I would take my profits and run. However, if the stock hits the 61.8% Fibonacci Level, I may consider leaving the options overnight. i.e. changing my stance from a day trade to a swing trade.
The stock hovered at around its 38.2% Fibonacci level in intraday chart, which coincided with the 50% Fibonacci level in daily chart. Hence, at that level, it is a strong resistance. However, my intuition (at around 11:30pm) says that the stock will break the resistance. As to when exactly, I am not sure. It did break the resistance around 1:15pm and it went pass my two targets.
By the end of the day, the stock close around $162. My 150 Call option is deep-in-the-money with a closing price of around $14.575. That is, if I were to close my position before the end of the day, I would easily made $6.575 x 100 (before commission) per option contract or about 82.2% return in one day. I left the position open. On hindsight, I should have closed my position and opened a fresh Aug 165 Call at a lower premium (and thus locking-in my profit).
PersianCat (Millionaire-in-progress)
Monday, July 14, 2008
We had more bad news ...
The market is in its exciting period. Lots of volatility. Lots of traders lose money to the market makers. A lot to learn for all. We shall see what happens next.
During this period, I tends to trade intra-day rather than keeping my trades overnight.
PersianCat (Millionaire-in-progress)
Monday, July 07, 2008
Market in Triple Bottom?
I''ve been mentioning before and repeat it again in my handholding sessions that the current U.S. market correction is not the normal correction. Things are just too bad at the moment to be bullish about the market. So it is no surprise that the DOW drops 20% from its peak. I do expect a little more - maybe another 10% down.
But now, it is a good time to take stock after the July 4th Independence Day holiday.
The three major indices (DOW, S&P500 and Nasdaq Composite Index) are all in oversold territory. The oscillators (e.g. RSI, stochastics) for each of the 3 indices are at the low end. While I believe that the market is in for another thrashing, it needs to rest and retrace (in this case, go up) a bit before continuing its downtrend. Unless a series of bad news or an extremely bad news is announced, any little good news might push the market upwards in the short-term.
PersianCat (Millionaire-in-progress)
As such, what we could be seeing is a possible triple bottom being formed.